
Hey fam 👋. I’ve been thinking about doing a discussion on warfarin but after some thinking, decided that it might be best to discuss the INR lab test before delving into the world of warfarin.
I don’t know about you, but when I was in school, the only thing I knew about the INR is that it’s a blood test that tells you something about how thin your blood is – and if it was too high, you’d have to back down on your warfarin dose and if it was too low, you’d have to increase your warfarin dose.

But if you actually asked me to describe what these numbers actually mean? Well, I had no clue. Not a good grasp, anyway. And considering they have to cover about a bajillion medications and disease states in school – you can’t blame them. But in order to truly get a grasp on warfarin therapy, you first need to have a good concrete understanding of the INR test.

I know what you might be thinking – this sounds freaking dull. But, the story of the INR is actually a pretty wild one.
And it all started back with the PT lab test, aka prothrombin time. I swear we will eventually get to the INR – hang tight.
Even before the discovery of warfarin, a physician and coagulation pioneer named Armand Quick developed a novel test that helped to characterize how coagulable blood was (if you like history, I recommend reading this article by Quick himself https://www.ahajournals.org/doi/pdf/10.1161/01.CIR.19.1.92).
This test become known as the prothrombin time (PT).
Now, let’s look back at a visual of our coagulation cascade:
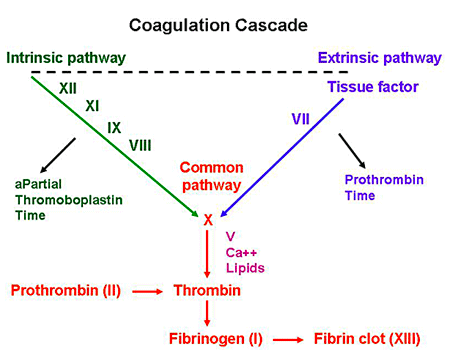
If you remember, the coag cascade has two main pathways that then converge into a common pathway: the intrinsic and extrinsic cascade.
The extrinsic pathway occurs when there is actual damage to the vessel wall, causing a protein called tissue factor to leak out of the vasculature wall, forms the complex of factor VIIa-TF, which then triggers the coag cascade, ultimately forming fibrin, a net that will solidify our platelet plug.

OK, so our PT test represents the extrinsic cascade – in other words, what happens if there is external damage and tissue factor is released – but how can we mimic this process in vitro….in a lab, rather than how it happens in a patient’s body?

In order to simulate this process in a lab – where we can actually easily measure it – we’ll need to add a few ingredients – I kinda think about this like getting the right ingredients to bake a cake. In order to get this to happen, we have to mix up the following:
- Platelet Poor Patient Plasma
- Phospholipid
- Calcium
- Tissue Factor (TF – historically known as tissue thromboplastin)
Platelet Poor Patient Plasma
Our first ingredient in our clot cake (ew that sounds gross, I’ll stop now) is patient plasma. If you recall, our blood in our bodies (aka whole blood) can be further divided into a few different parts:

If you spin (centrifuge) blood, you’ll get three distinct layers – the formed elements, the buffy coat, and plasma.
The plasma contains all of our proteins and our clotting factors. By spinning out whole blood and using only plasma in our PT test, we avoid the interaction of platelet activity.
BREAK! Let’s use this new knowledge.
What effect do antiplatelet agents like aspirin, clopidogrel, ticagrelor, etc have on the PT lab test?
Because the PT test uses platelet poor plasma, and not whole blood, we shouldn’t expect these agents to have any effect on the PT.
Phospholipids
Next are phospholipids. Clotting factors need a surface in order to activate into their different complexes. In vivo (in the body), the plasma membranes of activated human blood platelets provide this catalytic phospholipid surface where these complexes can be assembled. Without this phospholipid surface, coagulation factors, tissue factor – they all cannot have their optimal activity. Because we already took our the platelets from our sample and are only using plasma, we’ll need to simulate this ideal environment in our test tubes. We do this by sprinkling in phospholipid emulsion.
Calcium
Have you ever donated blood or had to get your blood drawn for a test? Have you ever wondered why that blood you gave didn’t just immediately clot in the test tube or donation bag? Meanwhile, if you give yourself a papercut, your blood will immediately clot up.
What’s going on here?

Luckily for us, way back in the day – specifically in 1890, scientists Arthus and Pages had discovered that if they added sodium oxalate to blood, it would lose its ability to clot – in other words, blood in the presence of sodium oxalate became incoagulable. (ARTHUS, M., AND PAGES, C.: Nouvelle theorie ehimique de la coagulation du sang. Arch. physiol. norm. et path. 2: 739, 1890.). However, they saw that if you added calcium to the blood-sodium oxalate mixture, that its clotting ability would be restored.
Calcium is an important part of the coagulation cascade – without calcium, you can’t generate a clot. If you look back at the ol’ coag cascade you’ll see it’s actually a cofactor throughout the cascade.
Have you ever noticed that the tubes they take your blood samples in have a lil’ gelly like thing on the bottom?
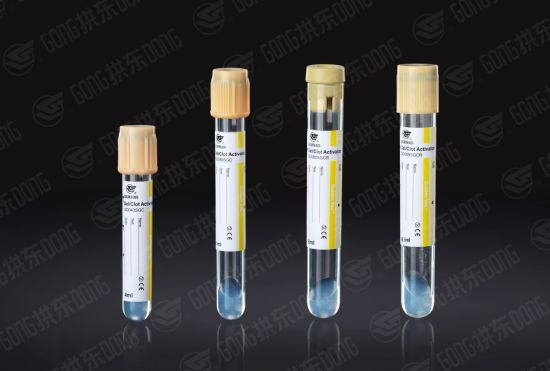
That jelly thing is actually sodium citrate most of the time – which can bind up all the calcium in your blood sample. No calcium – no clotting.
This is why it is so important to make sure bleeding patients have adequate calcium stores. In fact, during cases of massive transfusion protocol (MTP), where we give a ton of blood over a short period of time, every bag of donated blood we give will deplete calcium in your patient. Which is why it’s so important that you replete calcium throughout an MTP. You can give all the blood in the world, but without calcium, you’re not going to generate a clot.
Tissue Factor
Tissue factor, also known as tissue thromboplastin, is a protein that is present within the lining of your blood vessels. Under normal circumstances, your vessels are nice and healthy and intact – and tissue factor is kept within that vessel wall. However, whenever there is trauma/damage made to that vessel wall, and it opens up, tissue factor will be released.
Tissue factor then will trigger the extrinsic pathway of the coag cascade and interact with factor VII to get the whole party started.
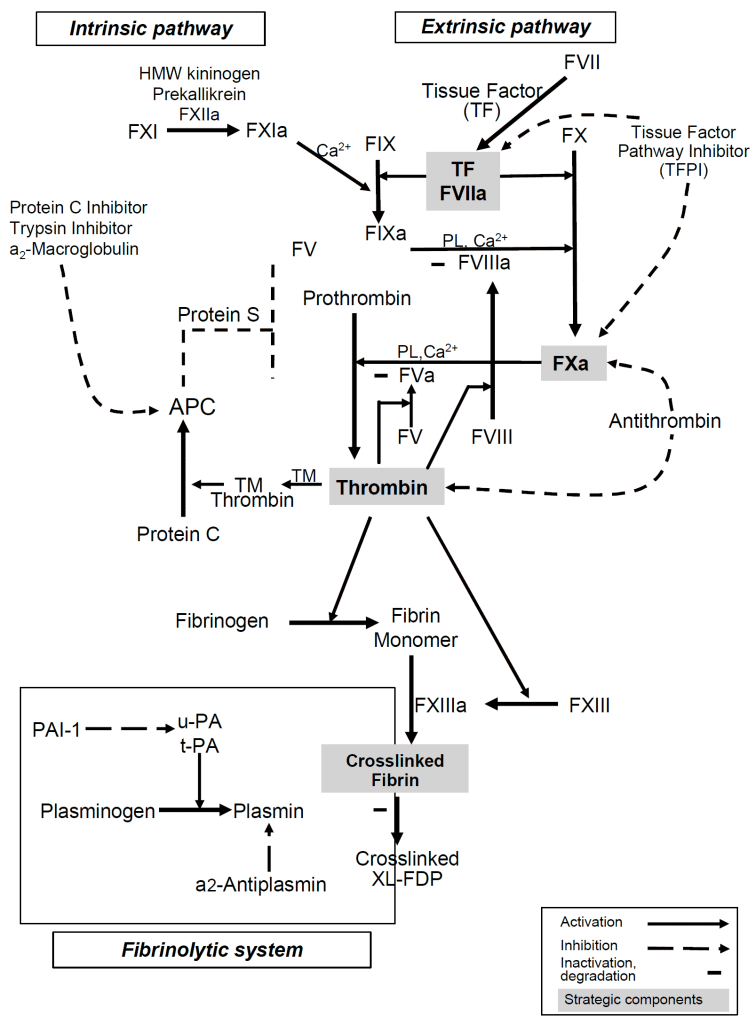
The addition of Tissue Factor (Thromboplastin) to the PT test is what makes the PT test specifically look at the extrinsic pathway.
Afterall, the intrinsic pathway is not triggered by tissue factor. Review the diagram below to see what I mean.
Alright perfect! Now we have all our ingredients to make this test happen. By adding all this good stuff, we can look at the activity of our extrinsic coag cascade (factors VII, X, V, II, and I) and start our clotting process in a test tube.

The way that the PT test usually detects time to clot is by measuring the turbidity of a sample (how clear vs cloudy a sample is) via photo-optimal means. In other words, the lab techs will use a machine that shoots light through this sample and when a certain level of cloudiness is detected, that sample is deemed to be clotted and the stopwatch will stop. You will then get a “time to clot” in seconds as a result.

Here’s an example of a clotted plasma sample ⬆️⬆️⬆️. This plasma is so solidified that it can hold up a steel ball upside down.
OK perfect! Now you know what the PT is and what it does.
Now let’s get into a little history.

The History of the PT and INR
In the 1930s, as stated before, the PT was invented. At the time, we didn’t have any anticoagulants.
Then the 1940s hit, and warfarin is discovered (we’ll go into that history another day).
Anyway, it quickly became apparently that we would need some sort of test to monitor just how anticoagulated our patients were, because it appeared that different people had different effects and sensitivities from warfarin.
Luckily for us, we already had the PT – which looked at the majority of factors that warfarin inhibits. The PT was a great test to figure out how intense anticoagulation was with warfarin therapy.
In the early days, warfarin therapy was monitored using the PT test. In those early days, the American Heart Association recommended that the PT should target a prolongation of 2.0-2.5x baseline.
Back in these days though, you couldn’t just go out and buy ingredients for the PT test from a manufacturer – no one made them in large supply.
So…in the early 1940s, if you were a junior pathologist working at a lab, part of your job every day would be to….extract thromboplastin (TF) from human cadaver brains and cook your thromboplastin supply each and every morning to use for your PT tests that day.
Woof.

Good news though! As these tests became more and more utilized as warfarin therapy increased – someone had the bright idea to manufacture these thromboplastins on a commercial scale.
In other words, you could just order these thromboplastins through a company and they’d send it to your lab! (today’s version would be ordering something through amazon – I’m definitely spoiled with that 2 day shipping)
This sounds fantastic right? Now these junior pathologists don’t have to cook up their own supply in every single lab in the country, every single morning! Wahoo!

However, drama happens. And the best part is, we didn’t even figure out what was going on with this drama until decades later.
🤦🤦🤦🤦🤦🤦🤦🤦🤦🤦🤦🤦🤦🤦🤦🤦🤦🤦🤦🤦

So. It turns out that those commercial thromboplastins that they took from various animal tissues were all contaminated with animal plasma. So instead of just getting tissue factor in these samples, what you also got mixed in was extra clotting factors from the animals they extracted these thromboplastins from.
Because you were adding in extra clotting factors (without knowing it), these PT tests run with these commercially available thromboplastins were relatively unresponsive to the depression of coagulation factors.
In other words – usually your patient on warfarin would have a decrease in their clotting factors (specifically II, VII, IX, and X) that you should have seen via PT test by a increased time to clot (more time to clot means less clotting factors, means “thinner blood”).
However, because we were unknowingly adding additional excess clotting factors from animals, you were falsely shortening time to clot making your patient on warfarin look subtherapeutic.
These changes in thromboplastins across the country took place without anyone really realizing the clinical implications….
Because of these less responsive thromboplastins, it required patients to take larger and larger doses of warfarin to get to the same target PT….and, not surprisingly, they started to see more and more bleeding in patients, and there was a diminished enthusiasm for anticoagulation agents as a result.

Guys. GUYS. It wasn’t until THIRTY years later that people started getting a lil’ sus about everything.
It was all thanks to two major papers, both published the same year (1982).


The first report looked to describe average warfarin doses based on geographic location. Not surprisingly, they found that the highest dose requirements were in North America, and that appreciably lower mean warfarin doses were in the UK (where they were still using human brain thromboplastin).
The second report looked at Canada versus the US. At the time, patients in Canada who were still using human brain thromboplastin were targeting a PT of 2.0-2.5 whereas those in America were targeting a lower PT goal of 1.5-2.0.
Despite the lower target PT goal in America, they still found that significantly larger doses of warfarin were prescribed in North America. They also found that bleeding in America on these higher doses, were – not surprisingly, higher as well.
And then it finally clicked. The issue this whole time had been their source of thromboplastin. This seemingly minor change in reagent source had booming implications. At with such widespread use of warfarin, it became clear that some sort of standardization of reagents or results had to be made.
✨Here comes the INR✨
The INR, aka the international normalized ratio, is simply a way to standardize all results from the PT test. In other words, I can be confident that an INR result of 2.3 in NJ would be an INR result of 2.3 in California, or North Carolina, etc.

The ISI is a way to standardize the PT results and providers an indicator thromboplastin responsiveness as it compared to the WHO (world health organization) reference preparation.
This means whatever reagent you buy and put in, you can still standardize a result by utilizing the ISI value provided.
Question! The other day I had a learner on rotation with me who was nervous because a patient’s coag labs showed both elevated PT and INR values. He was concerned with the patients overall bleeding risk given both of them were high. What would you say to this student in response?

Based on our discussion, it should make sense to you that it is impossible to have an elevated INR value with an elevated PT – the INR is just a way to standardize the PT value. Elevations in both of these values is expected. You can’t have one without the other.
INR values – what the heck do they really mean?
To get a good idea of what INR values are really telling you, I want to show you a graphic.


So to orient you, the graph above shows mean factor activity levels of the clotting factors warfarin inhibits (VII, X, IX, and II) and the correlating INR value. FYI – an INR of ~1 is considered “normal” (someone healthy not on warfarin).
Do you see anything interesting with the above?
If you look closely, you can see that increases in INR values near baseline (e.g. an increase of INR from 1 to 1.5 or from 1.5 to 2) result in a dramatic decrease in factor activity levels.
However, the higher the INR value, the less dramatic the decrease in factor activity levels. In other words, there’s really no big clinical difference between an INR value of 5 versus 7. This is why a lot of labs do not even bother reporting high INR values and will just report an INR value of >5, for example.
What can we do with this information?
Well, if I had a patient with a recent DVT who was on warfarin with an INR goal of 2-3 and they came back subtherapeutic at 1.5 – I would be aggressive in getting them to goal since I know there is a large difference between an INR of 1.5 versus 2. However- if I had a patient with a mechanical mitral valve with an INR goal of 2.5-3.5 and they came in with an INR of 3.8? I wouldn’t freak out and drastically scale back the dose.
Pitfalls of the INR (and PT, and aPTT, for that matter)
The last thing I want to touch on today is the relative issues that come with the INR test. Now that you understand how the test is actually performed, it might become clear that there are a lot of factors that can interfere with its results.
Things that can falsely increase the PT/INR – a nonexhaustive list
- A short draw – in other words, not taking enough blood – this will end up causing an excess of sodium citrate in the plasma, binding up more calcium than expected and falsely increasing time to clot
- Patients with elevated hematocrit – this means there will be less plasma per unit of blood taken – less plasma, means less clotting factors, means longer INR result
- Clotted sample – pretty self explanatory
- Samples >24 hours old
- Hemodiluted samples (if you have dilution in your sample (for example if you take blood near where NS is running or if you draw from an A line without proper clearance), you will end up with less plasma in the same, less clotting factors – higher INR)
- Heparin contamination via flushes (heparin also works on factors II and X- no bueno)
- pRBC transfusions
- Blood volume expanders
- Liver disease
- DIC
- Any contamination with argatroban, bivalirudin, dabigatran, rivaroxaban, edoxaban, apixaban
Things that can falsely decrease the PT/INR – a nonexhaustive list
- Low hematocrit
- elevated Ca levels in your patient
- poorly collected sample
- fresh frozen plasma infusions
- hemoconcentration
- a long draw
- lupus anticoagulant
In other words – if an INR result looks wonky, it might just be wonky. Get a repeat.
Thanks for joining today.

One thought on “What is the INR?”