
Hey guys! Today’s talk is not specific to cardiology, but a talk I find myself having often with learners that will help them no matter what field they go into.
Let’s talk a little drug lit today.
I know what you’re probably thinking:

But seriously, this stuff ends up being quite important – and interesting (in my lowly opinion) – once you can really grasp the importance, pros, cons, and nuances of these things.
Today I want to discuss composite endpoints and subgroup analyses and dive all into the pros, cons, pitfalls, and challenges associated with both.

Composite Endpoints
Let’s start with composite endpoints. I’m a very practical visual learner – and learn with concrete examples, so I’m going to teach the same way (apologies in advance if you don’t learn best this way).
What is a composite endpoint?
A composite endpoint is an endpoint in a trial that is made up of a combination of multiple clinical endpoints.
For example, if a trial was looking at a primary endpoint of death – this would be considered a non-composite endpoint.
However if a trial was looking at a primary endpoint of death, stroke, or hospitalization – this is an example of a composite endpoint.
Why do trials use composite endpoints?
A big advantage of using composite endpoints in trials is time.
Hm… what do you mean by that?
Well, the more frequently events occur, the faster a difference can be seen, and the less time a trial will have to go on to meet statistical significance.

Let’s use an example. And these are weird examples, but they usually work well for my learners.
Let’s say we wanted to conduct a trial to see if there is any difference between the amount of times you blink versus the amount of times I blink.

Do you think that study would take years to complete? Or maybe can be completed in a span of a few weeks or days? Why or why not?
….[insert you thinking through an answer here]
Because blinking is something that is done so frequently, if there was a difference in the amount of times you versus I blinked it would be something we’d see fairly quickly. For example, let’s say we found out that on average, you blink 5 times per minute – and I blink 8.
Over one day, the difference between your # of blinks and mine would be: 7,200 versus 11,500.
That’s a big difference – and likely we could reach statistically significance fairly quickly because the event rate happens so often.

Now – let’s look at another example.
Let’s say we were conducting a study that was looking at the difference between the amount of times you vomit versus I vomit.
Now – I don’t know about you – but I hate vomiting. And it doesn’t happen often. Maybe not even once a year. Assuming you are healthy, you probably don’t vomit that often either – you are likely like me where it happens so infrequently – once a year, maybe not even.
To be able to detect if there’s a statistically significant difference between the amount of times we vomit – do you think that study would take weeks? years? longer?
Because the event rate happens so infrequently, it hopefully makes sense to you that this type of trial would take years – if not longer.

Now, let’s tie it all together.
In order to avoid having to following their patients for years and years and years, trials will often opt to use a composite endpoint to save time in their studies. Afterall, trials are very, very costly to run.
By capturing multiple endpoints, they are able to increase the amount of events (aka event #) in a study so can run the study for a shorter period of time and still find a statistically significant difference.
This is actually good because by shortening the time a trial may be run, the cost is reduced, and you might argue that more trials will be started/come out as a result.
The Pros of a Composite Endpoint
The good thing about a composite endpoint is finding statistical significance in a shorter period of time.

The Cons of Composite Endpoints
There are a lot of cons about composite endpoints. “Cons” might be a little too strong of a word, but there are things you should know when assessing composite endpoints.
- Misleading Results
Just because a composite result is statistically significant, doesn’t mean that every component of that endpoint met significance. For example, let’s look at an example – the ISAR REACT 5 trial.
By the way – between me and you – if you haven’t hear about wiki journals, they can be a fantastic resource. Wiki journals is exactly what it sounds like – a wikipedia page that summarizes landmark trials. Though it does not at all replace the value of reading a trial first in its entirety, it is a fantastic resource to quickly find results or other information for a trial.
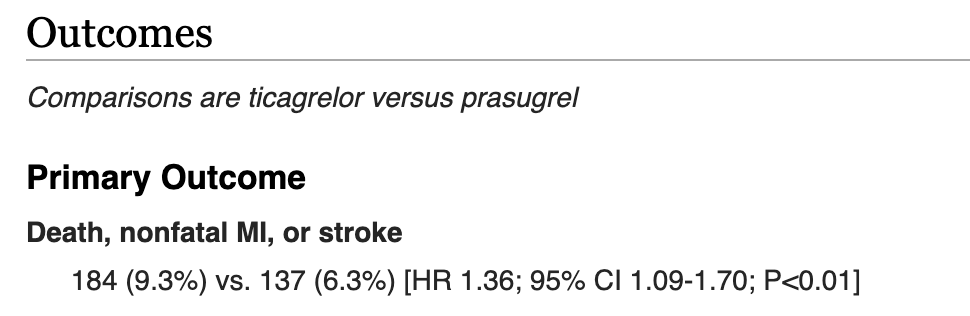
If you check out the ISAR-REACT 5 trial here (https://www.wikijournalclub.org/wiki/ISAR-REACT_5), you’ll see that they compared ticagrelor versus prasugrel in ACS patients and they looked at a composite primary outcome of death, nonfatal MI, or stroke.
If you scroll down to results, you’ll see that the primary endpoint was statistically significant (confidence interval did not cross 1 and P<0.01).
Though this may look like prasugrel was better than ticagrelor when discussing each component: death, nonfatal MI, or stroke – this is not actually the case.
Any decent study that has a composite endpoint should also report the rates of each individual component of the composite endpoint. ISAR-REACT 5 did this.
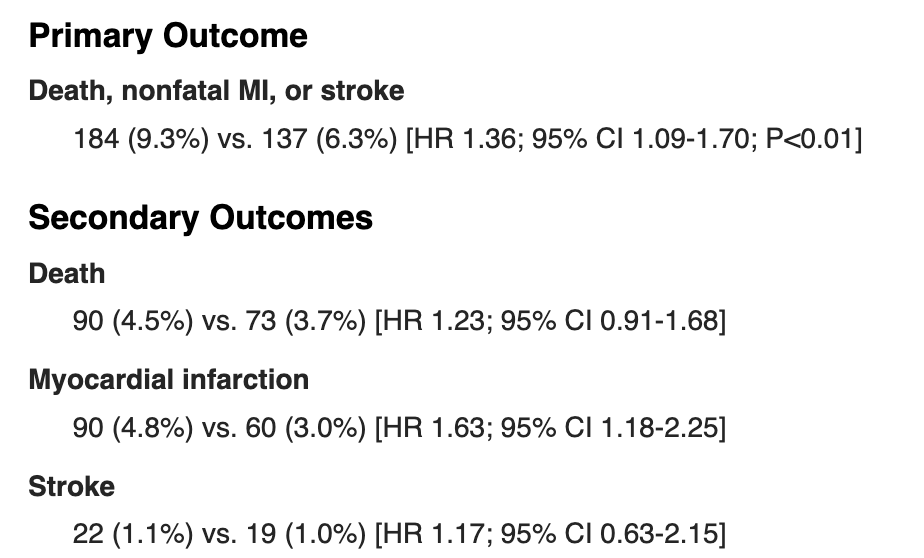
If you actually take a look at the data, you’ll see that prasugrel did not meet statistical significance for stroke or death, and only reached significance for those with myocardial infarction.
In other words, even though someone might see this study quickly and think that prasugrel reduced stroke AND death AND MI – it really didn’t. It only showed benefit at reducing MI in these patients.
The fancy way we would report these findings is that “prasugrel had statistically significant lower rates in the composite endpoint of death, stroke or MI, though this was driven by reduction in MI rates”.
The opposite can also be true.
Let’s take a look at the synopsis of the TOPCAT trial for HFpEF patients. Put this URL in: https://www.wikijournalclub.org/wiki/TOPCAT.
The TOPCAT trial was a landmark trial that looked at the use of spironolactone in HFpEF patients. Its primary outcome looked at CV mortality, aborted cardiac arrest, or HF hospitalizations and it was compared to placebo.

If you were to only look at the primary endpoint of this trial, you would find that spironolactone did not statistically reduce the primary outcome of CV mortality, aborted cardiac arrest, or HF hospitalization.
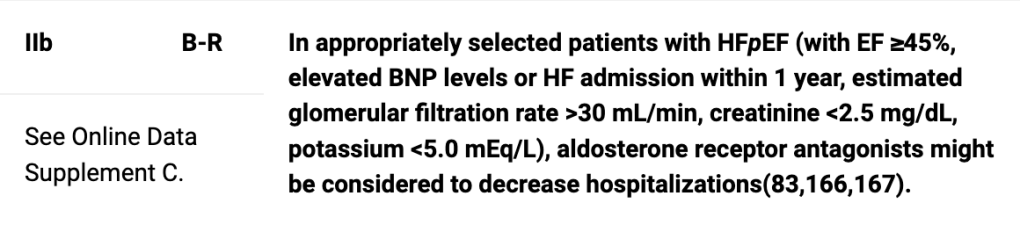
However, if you look at the individual endpoints, you will notice that spironolactone significantly reduced the rate of HF hospitalization, with a P=0.04, and a number needed to treat of 45, which is what led us into including spironolactone in the latest guidelines.
Once again – if you just go off of what you see in the primary outcome, you may be fooled into thinking there was no effect when there actually was.
2. Unimportant Clinical Outcomes
You may also see a study that ends up making a composite outcome that has some really great clinical outcomes mixed with one or two really wtf/unimportant outcomes.
This is a dramatic and silly example but let’s say we made a primary composite outcome that looked at: the rate of CV death, stroke, ventricular arrhythmias and……farting.
Let’s say whatever drug we’re studying makes people fart. A lot.
Well, by putting this silly, arguably unimportant clinical outcome and mixing it in with more concrete, really important outcomes, you can totally skew data.
In other words, there might not be ANY difference compared to placebo in what this drug does to prevent CV deaths, stroke, or ventricular arrhythmias…..but, if the difference in farting is drastic enough, well, that outcome might skew ALL your data and give your drug a pretty gold star and let you publish a paper that says “my drug statistically significantly altered the composite endpoint of CV death, stroke, ventricular arrhythmias, and farting.”
TLDR: always make sure each and every clinical outcome in your composite endpoint is clinically important to you – because, you might just find that some BS outcome in your composite is completely mucking up this data, making it look like something its not.
Now let’s move on to subgroup analysis.
What is a subgroup analysis? Why do trials do it?
Subgroup analysis is a type of analysis that can be done where you break up your study participants into different subsets of participants based on shared characteristics.
The pros of subgroup analyses
Subgroup analyses are instrumental to the research process. It’s a way for us to explore what benefits our different therapies have in different populations.
Let’s say I’m studying a cardiac drug. Besides my primary endpoints, I might want to investigate whether or not this drug is beneficial or not in different groups of patients. I might group my patients into different subgroups based on age, race, and other cardiac specific factors (ejection fraction, history of ACS event, etc). If I see that one of the subgroups perform really well, then that generates the hypothesis that that drug might help those specific patients.
Let’s use a real world example.
A perfect example would be to look at the course of the use of isosorbide dinitrate/hydralazine in African American patients with heart failure with reduced ejection fraction (HFreF). We know today that ISDN/hydralazine reduces mortality specifically in African American patients. But how did we figure that out?
It all goes back to the original trial – the V-HeFT trial – that examined the use of ISDN/hydralazine in patients with HFrEF and its effect on mortality in these patients.
Wiki-journal page here -> https://www.wikijournalclub.org/wiki/V-HeFT.
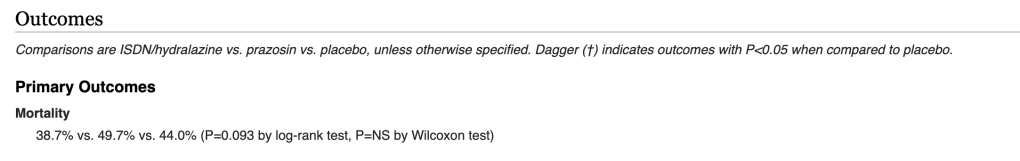
If you look at the primary outcome of mortality, you’ll find that there was no statistically significant difference between ISDN/hydralazine versus placebo.
Rats.
But then how did we figure out that ISDN/hydralazine is beneficial at reducing mortality in such a specific population?
You guessed it – subgroup analysis was what paved the way.
Though not done in the original published study, Carson et al. decided to do a post-hoc (done after the original trial based on the trial’s data) subgroup analysis looking at whether or not there was a difference in outcomes based on race (DOI: 10.1016/s1071-9164(99)90001-5).
The subgroup analysis found that there did indeed seem to be a difference, and saw a decrease in mortality in African American patients taking ISDN/hydralazine with a P=0.04.
This hypothesis-inducing subgroup finding prompted a new trial focusing exactly on this – the AHeFT trial (10.1056/NEJMoa042934). Looking at n=1050 black patients with heart failure confirmed that ISDN/hydralazine indeed did reduce mortality in black patients.
This is just one example of how a subgroup analysis inspired further research and led to important findings.
The Cons of Subgroup Analyses
The most important thing to keep in mind with subgroup analyses is that – at best – the findings should be hypotheses driving. In other words, you can’t take subgroup analyses findings as fact. Instead, just as we saw in the above, they serve to create new trials investigating the true effect of the subgroup.
A perfect example illustrating this is the 1988 ISIS-2 trial. This was the trial that confirmed, for the first time on a large scale, the benefit of aspirin use in acute coronary syndrome.
At the time of submission to the prestigious Lancet journal, the reviewers had one request: in order to get accepted in their journal, they would require a subgroup analyses to be done.
Very tongue in cheek, the authors did the most badass move of all time – among other subgroups, they stratified patients based on their astrological signs.

You heard me.
And they actually found that – for patients born under Gemini or Libra, aspirin was not only NOT beneficial, but that there actually seemed to be a slight adverse effect of aspirin for these patients.
A hilarious example – but an important one. Because obviously astrological sign likely has nothing to do with how patients respond to aspirin.
The lesson is this: if you fish for long enough, you’ll find something.

In order to truly confirm results of a subgroup analyses – further research directed specifically at these patients must be done.
(between you and me, this is why I wasn’t the biggest fan of sacubitril/valsartan being approved in HFpEF patients based solely on data – if you look at the landmark PARAGON-HF trial, which investigated sacubitril/valsartan in HFpEF patients – you’ll find that sacubitril/valsartan failed to meet significance not only in the primary composite outcome, but also in each individual component of the primary composite outcome. In fact, the main reason it was approved based on one of many, many subgroups they decided to do. They found that, for patients with an EF <= 57%, treatment favored sacubitril/valsartan with a 95% CI of 0.65-0.95). That’s only my opinion but feel free to generate your own.
And that’s my first mini post on some drug lit stuff.

amazing meme
LikeLike